×
模态框(Modal)标题
在这里添加一些文本
Close
Close
Submit
Cancel
Confirm
×
模态框(Modal)标题
×
Home
About Journal
About Journal
Indexed in
Awards
Editorial Board
Guide for Authors
Browse
Current Issue
Just Accepted
Archive
Highlights
Topic
Most Viewed
Most Download
Most Cited
E-mail Alert
RSS
Subscribe
Download
Editorial Policy
Contact Us
Figure/Table detail
Indoor positioning technology based on CSI phase sampling density
CHENG Cheng, WANG Wei
Integrated Circuits and Embedded Systems
, 2024, 24(
1
): 73-77.
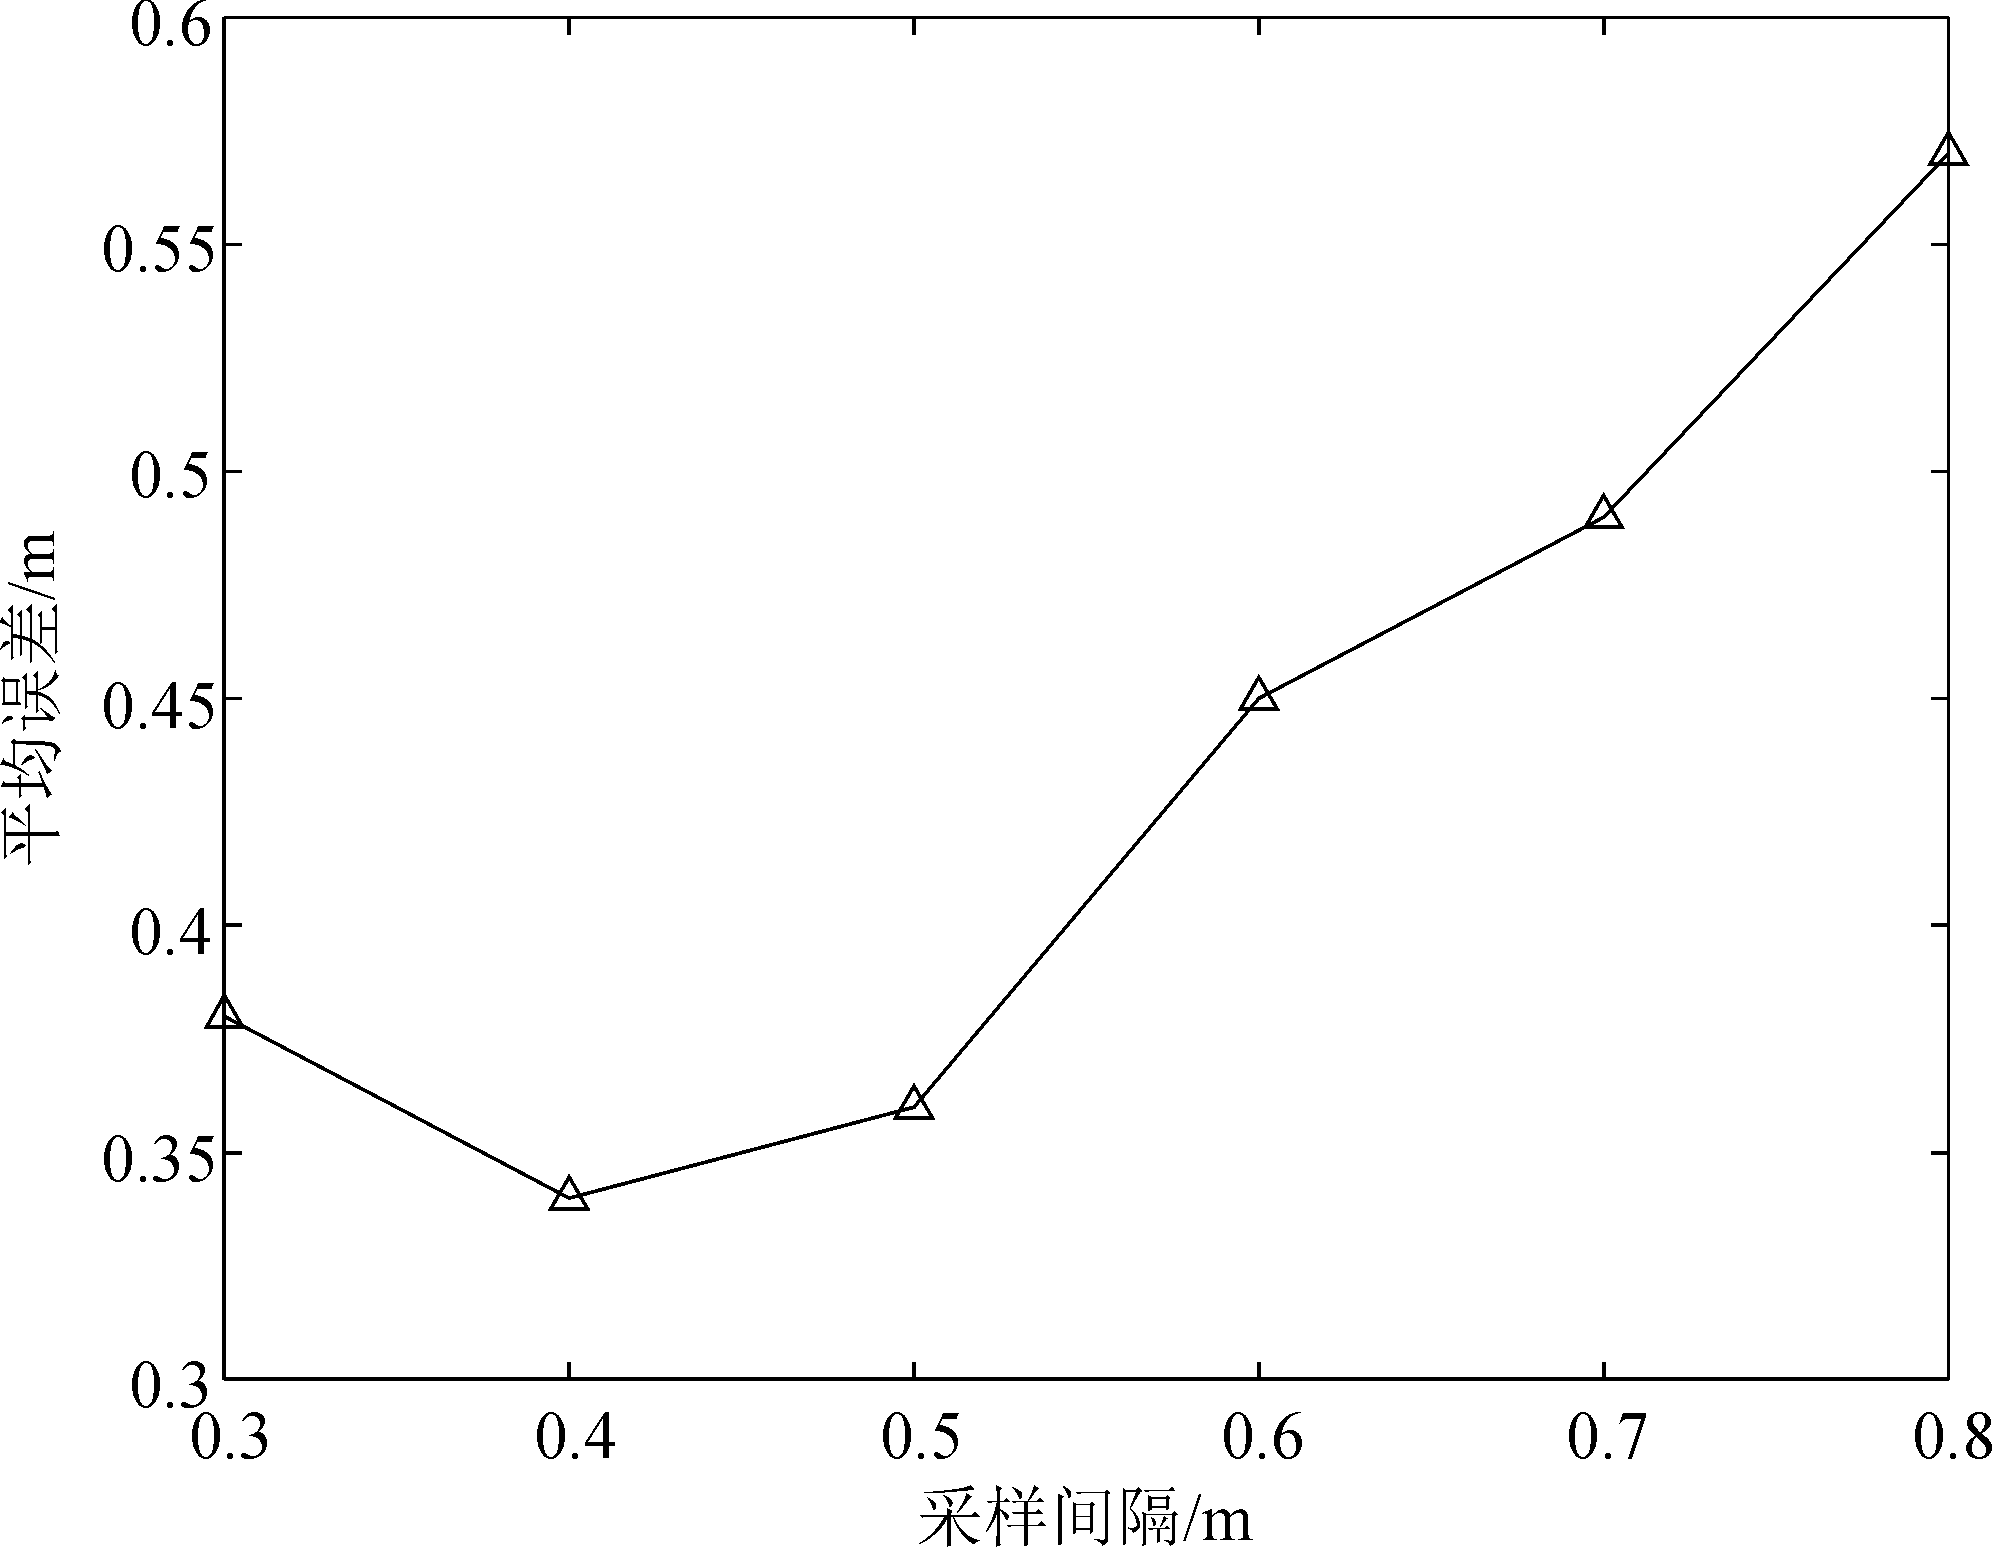
采样
间隔/m
采样点
个数
采样密度
(个/m
2
)
最大
误差/m
最小
误差/m
平均
误差/m
0.3
196
12.3
0.59
0.22
0.38
0.4
121
7.6
0.51
0.18
0.34
0.5
81
5.1
0.57
0.21
0.36
0.6
64
4.0
0.65
0.26
0.45
0.7
49
3.1
0.71
0.31
0.49
0.8
36
2.3
0.87
0.35
0.57
Table 1
Experimental errors for different sampling densities
Other figure/table from this article
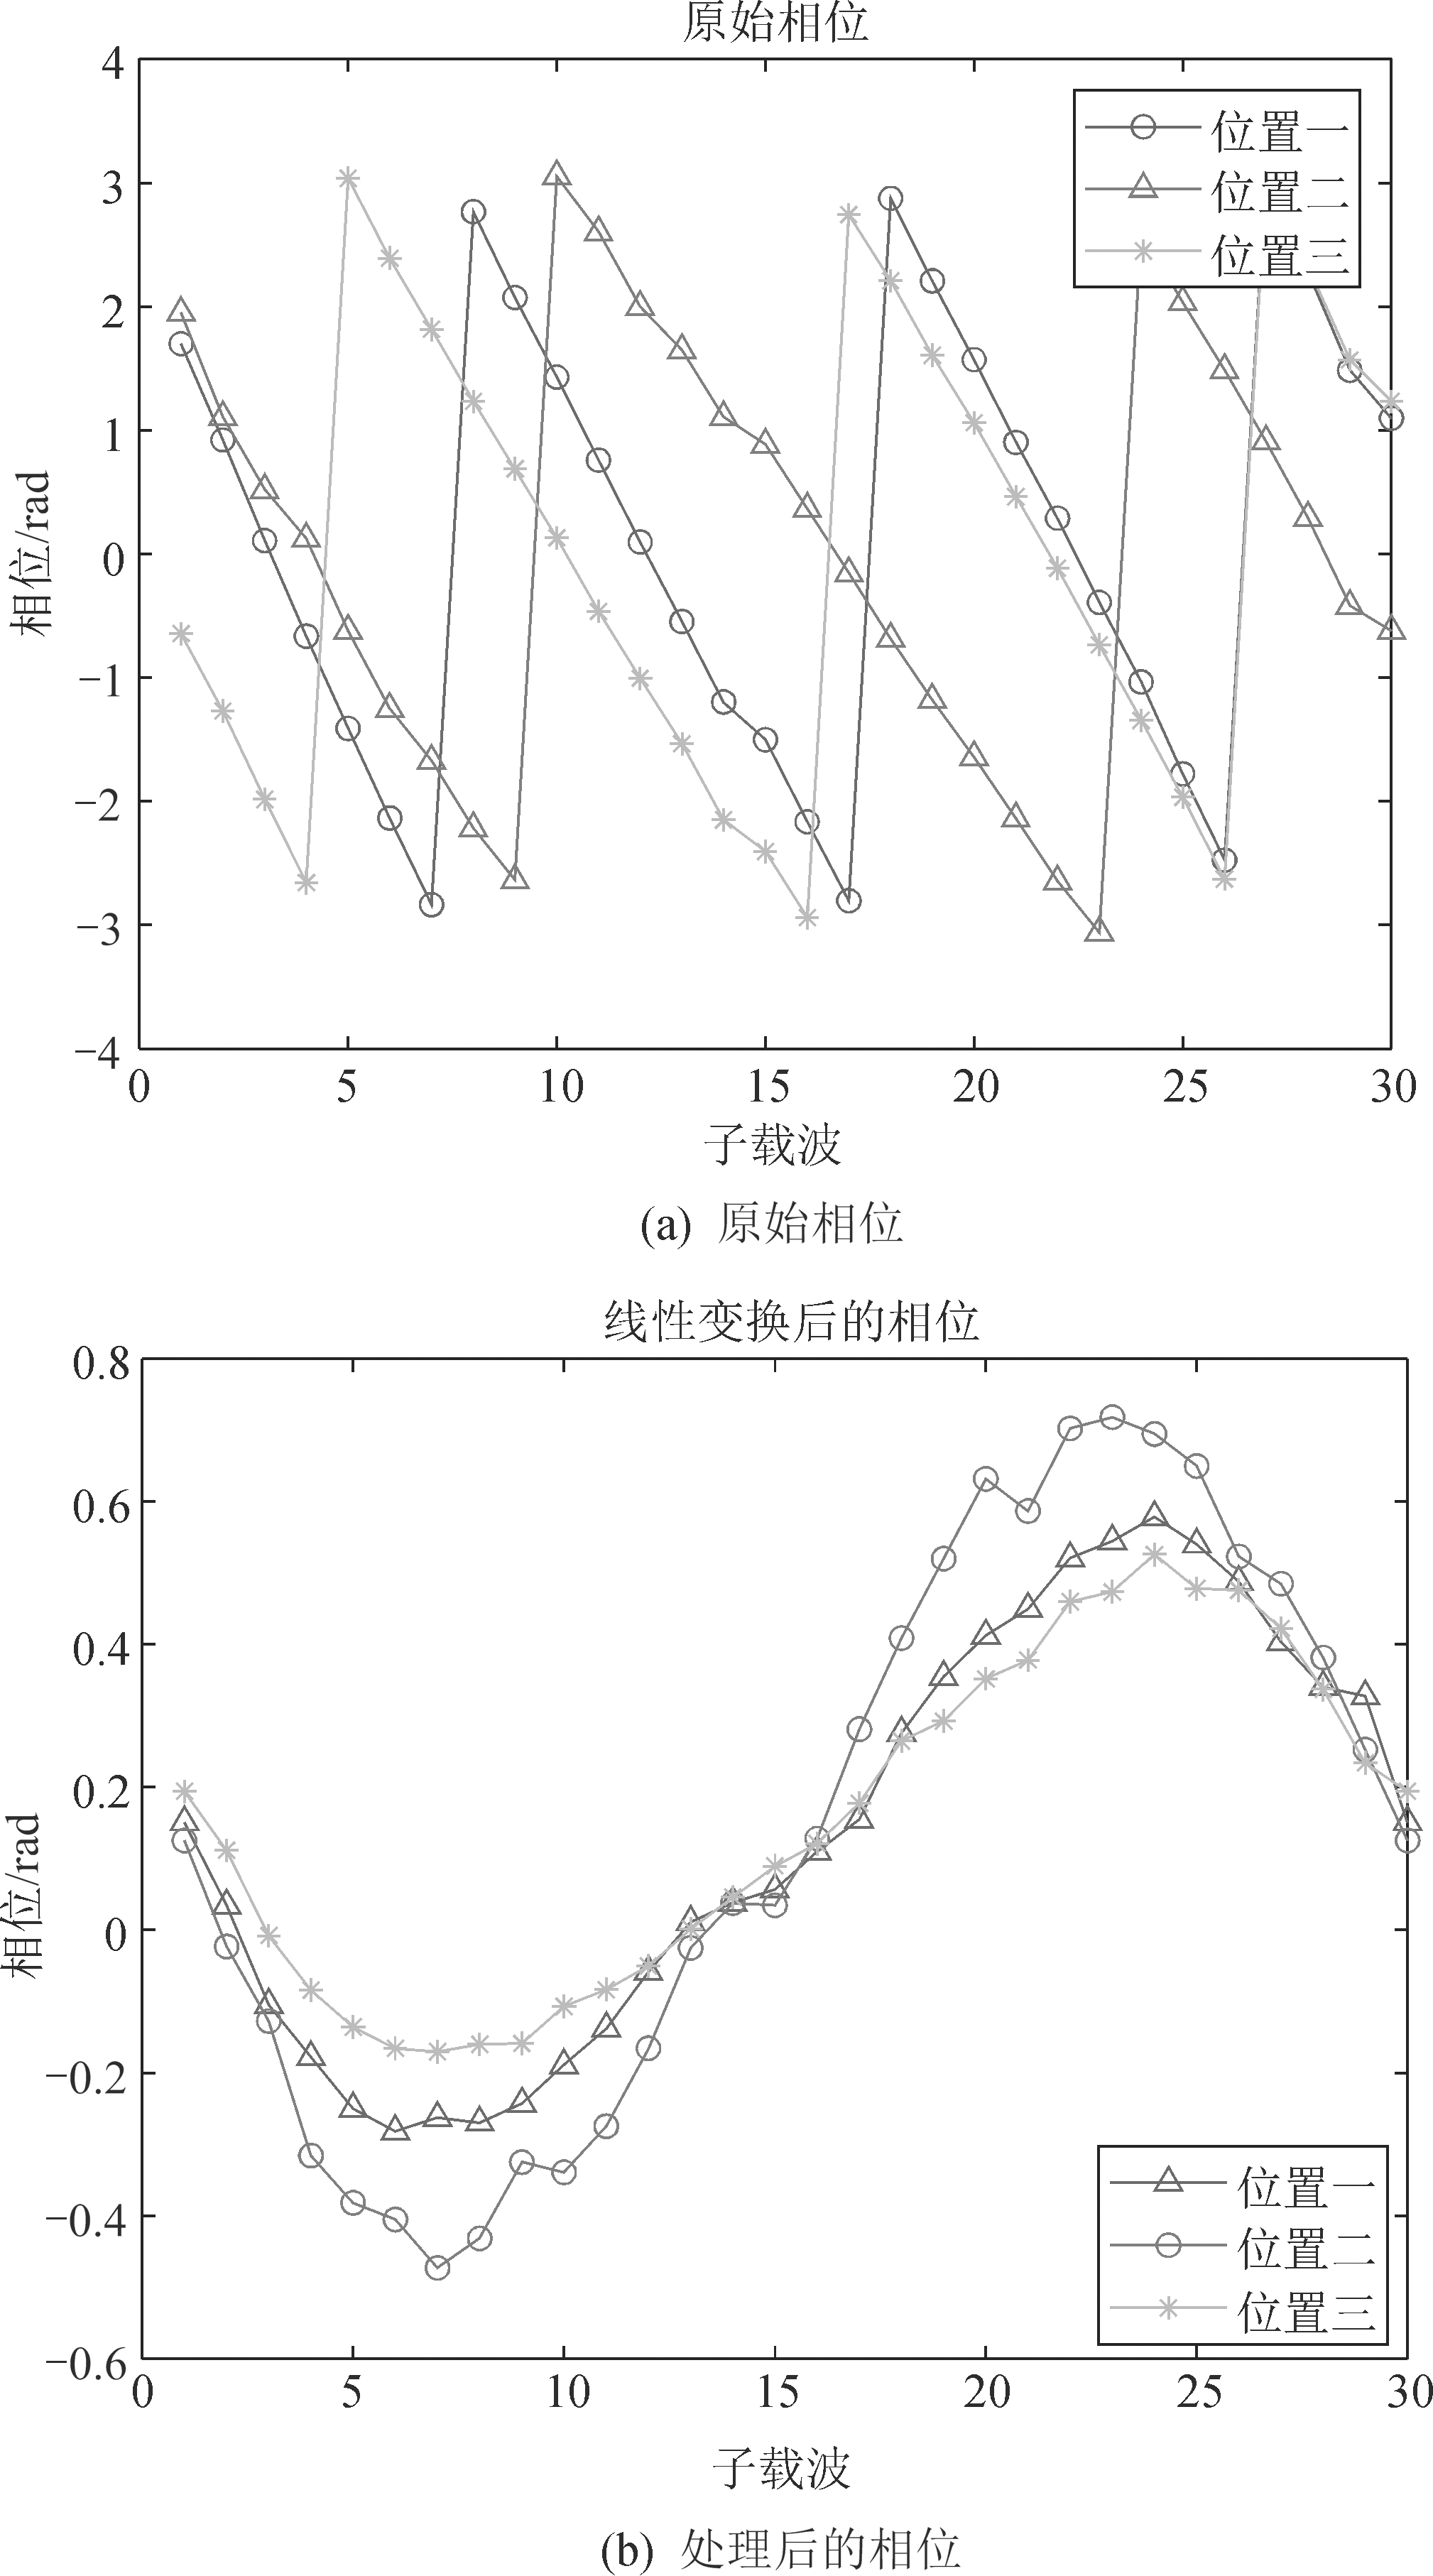
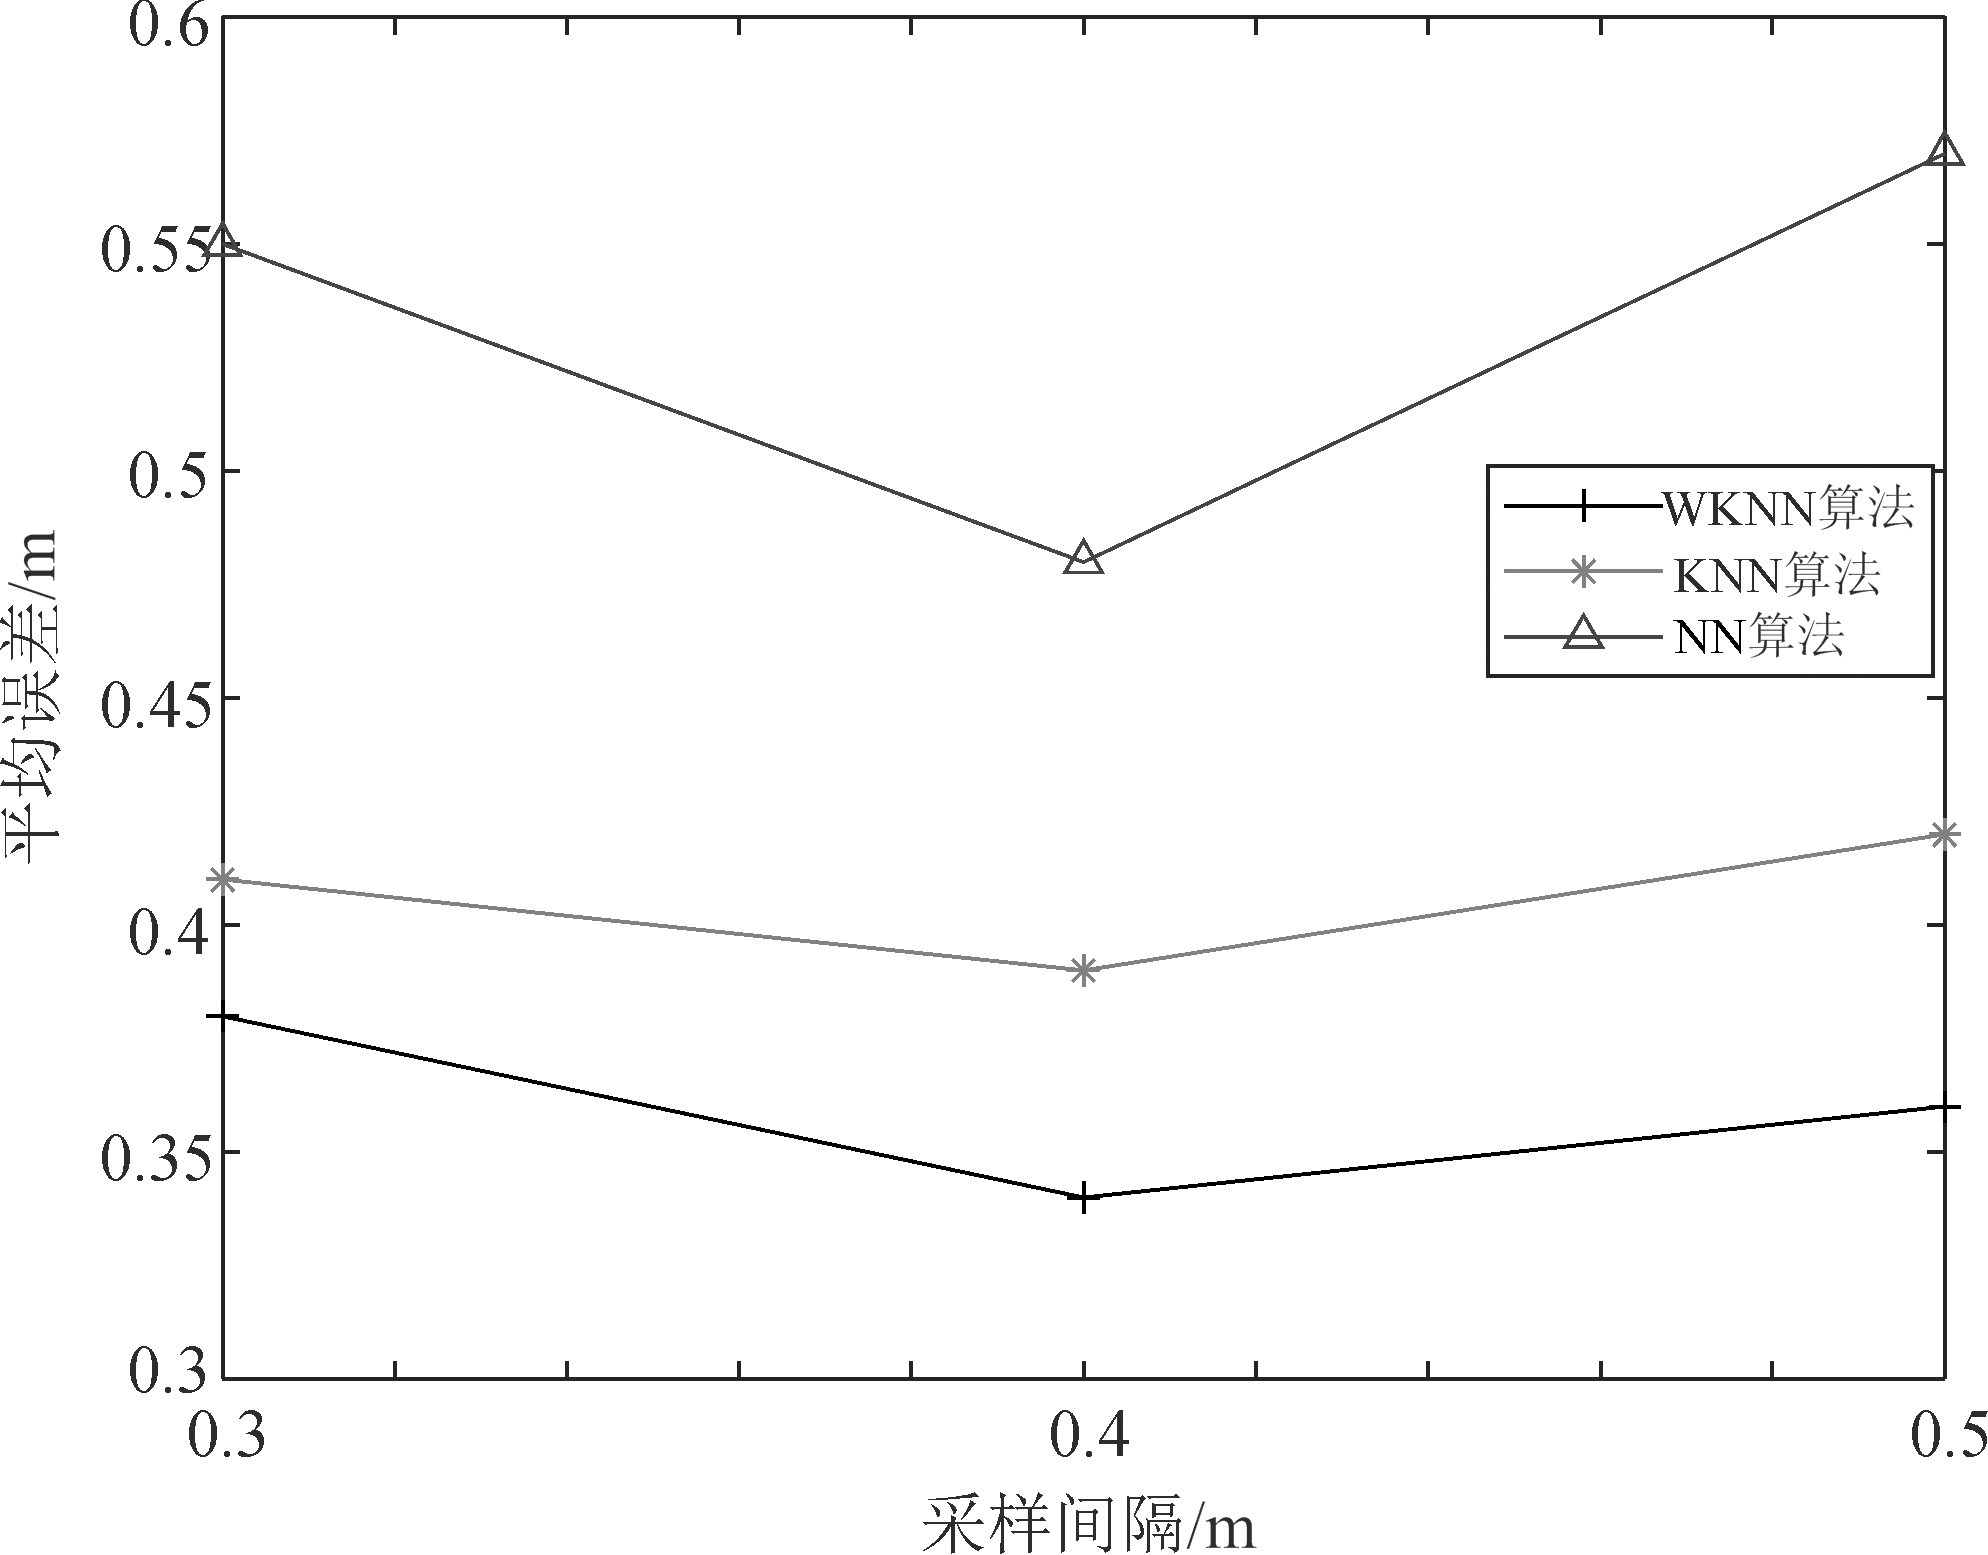
Fig. 1
Original phase and corrected phase after processing at three positions
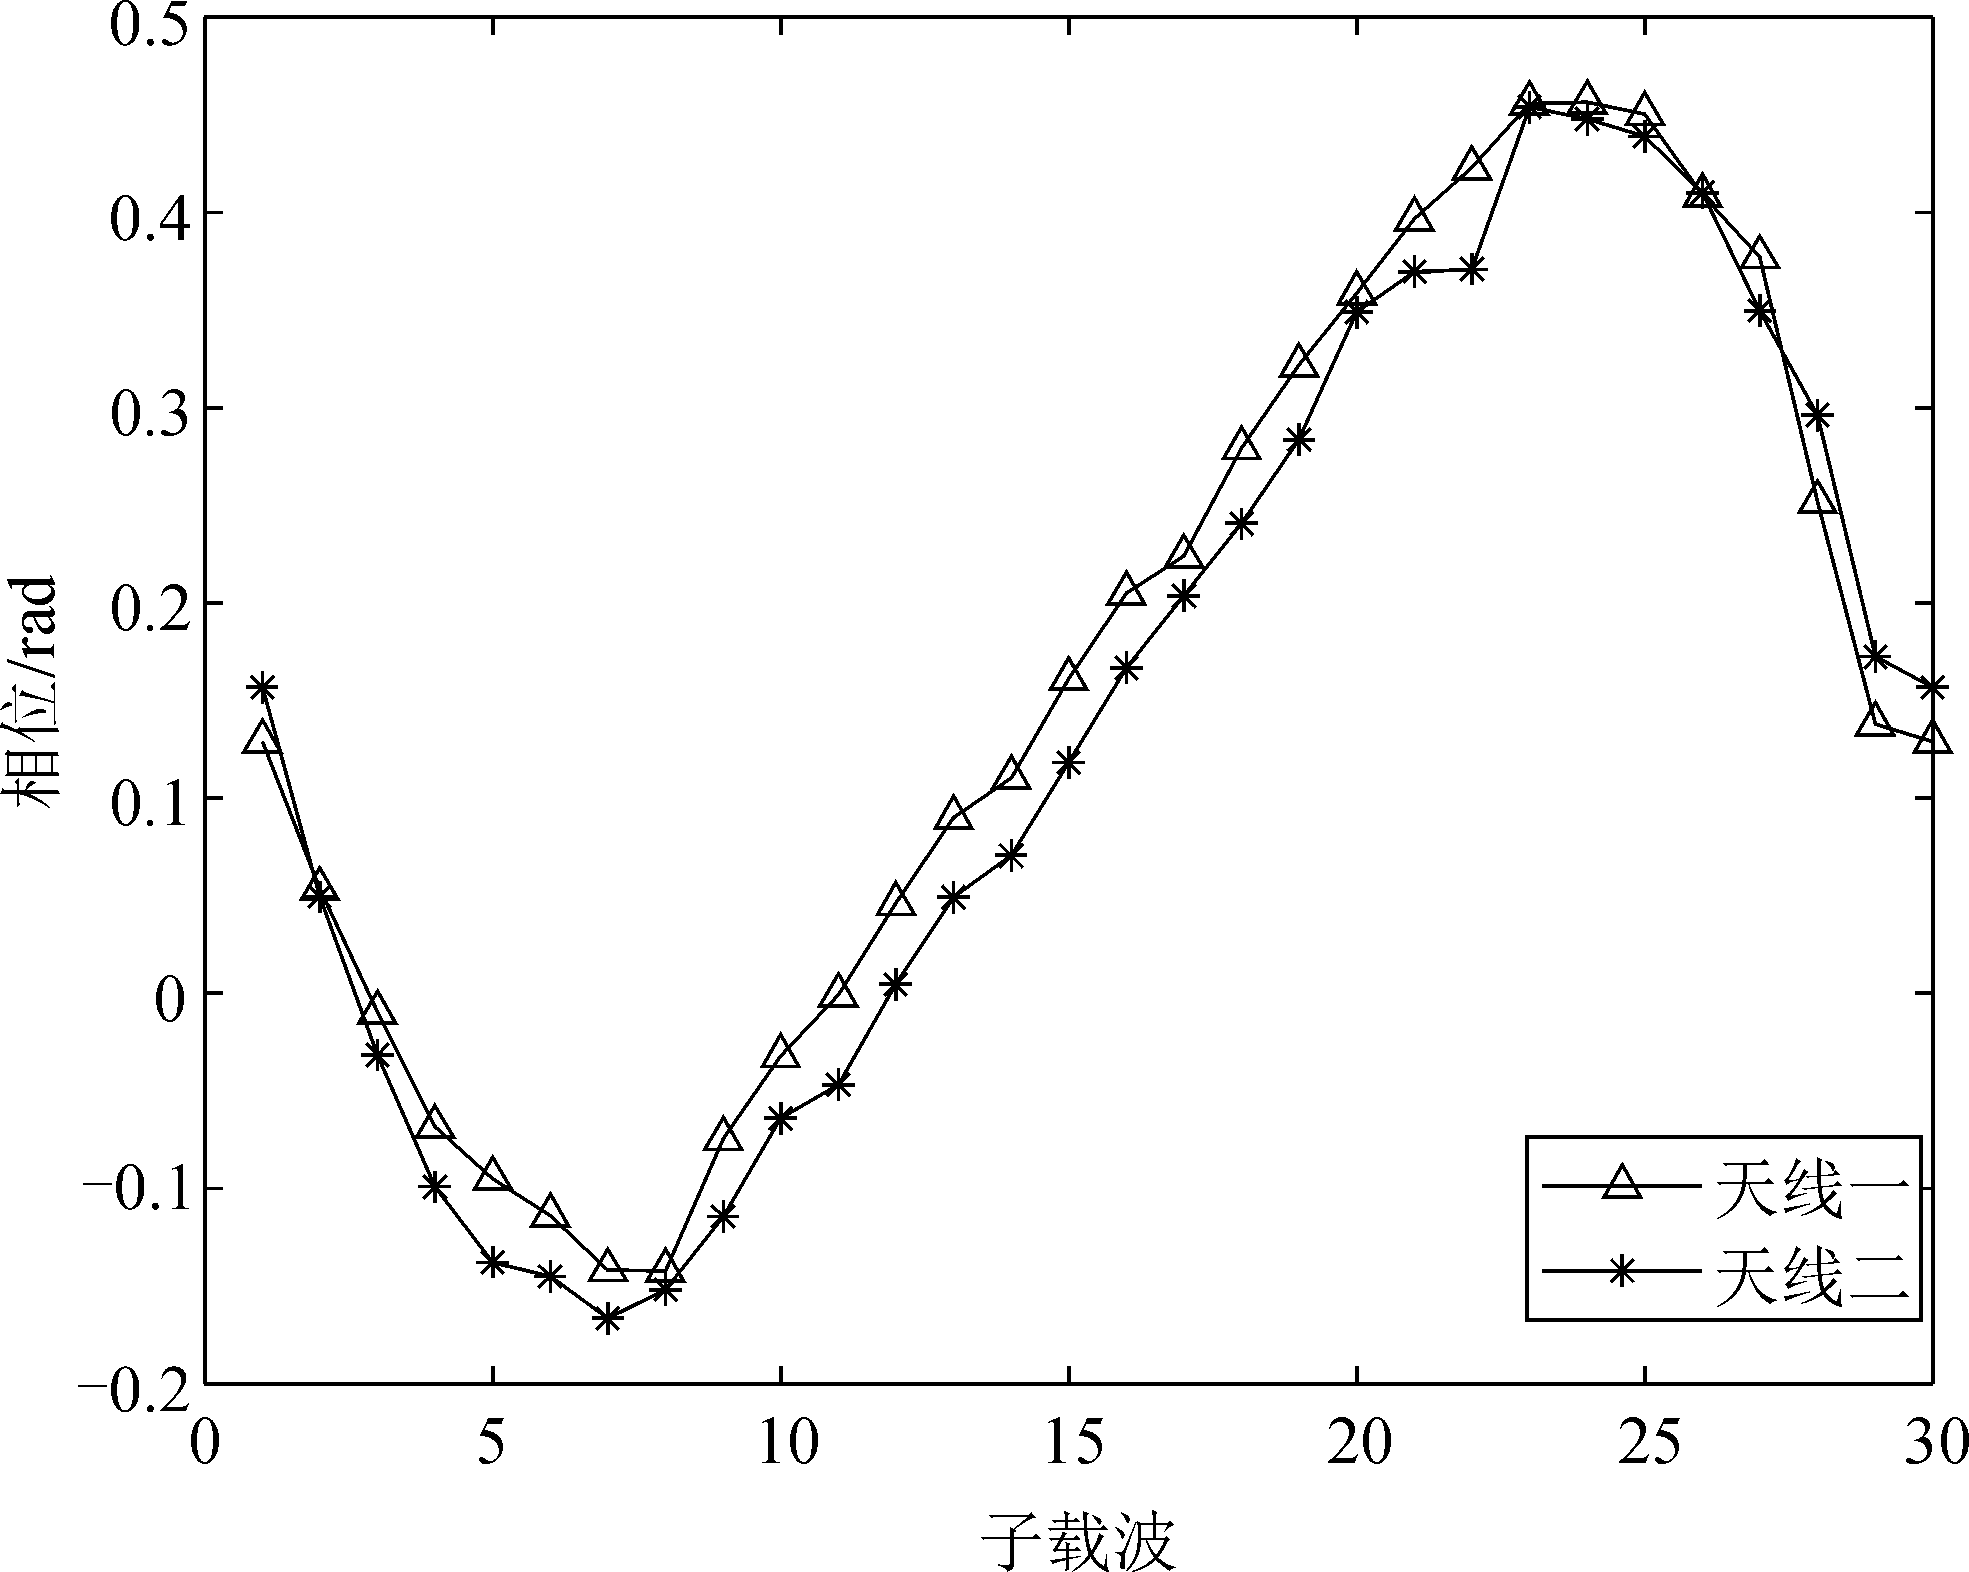
Fig. 2
Correction phase of two different antennas at the same position
Fig. 3
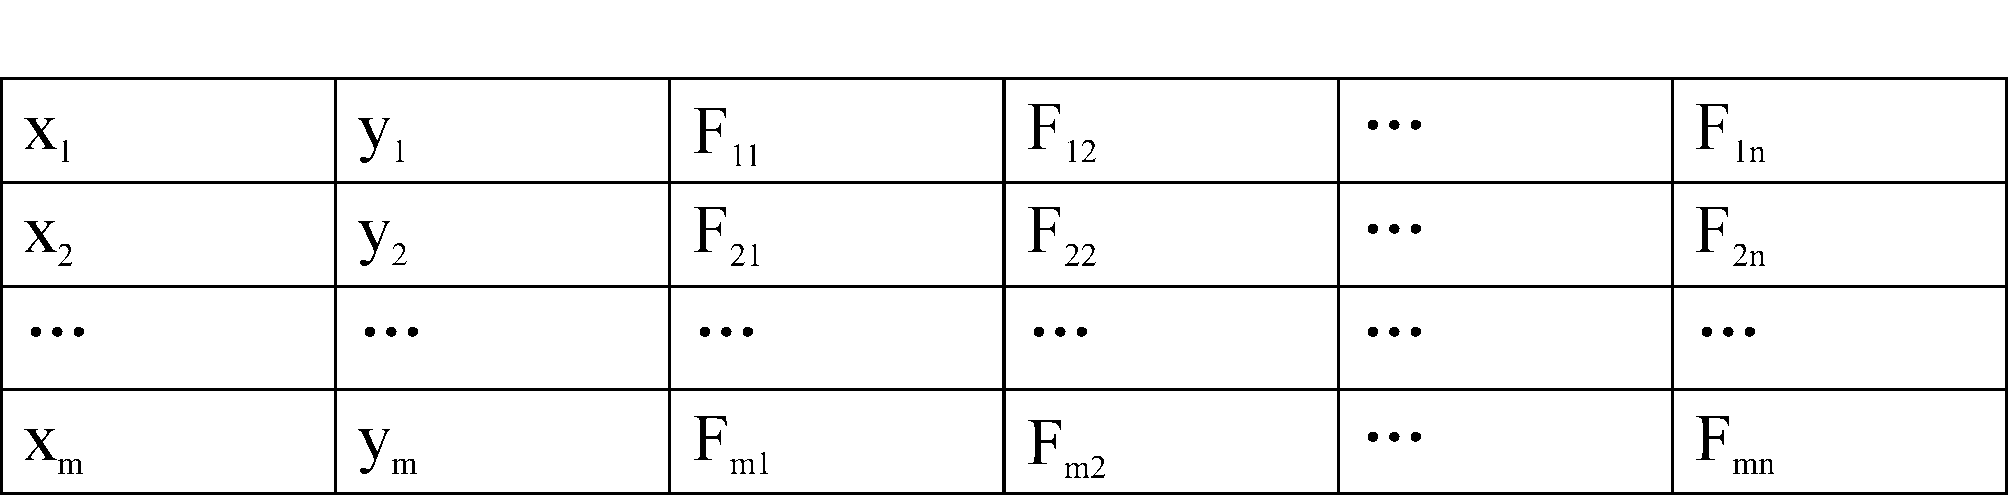
Fingerprint library format
Fig. 4
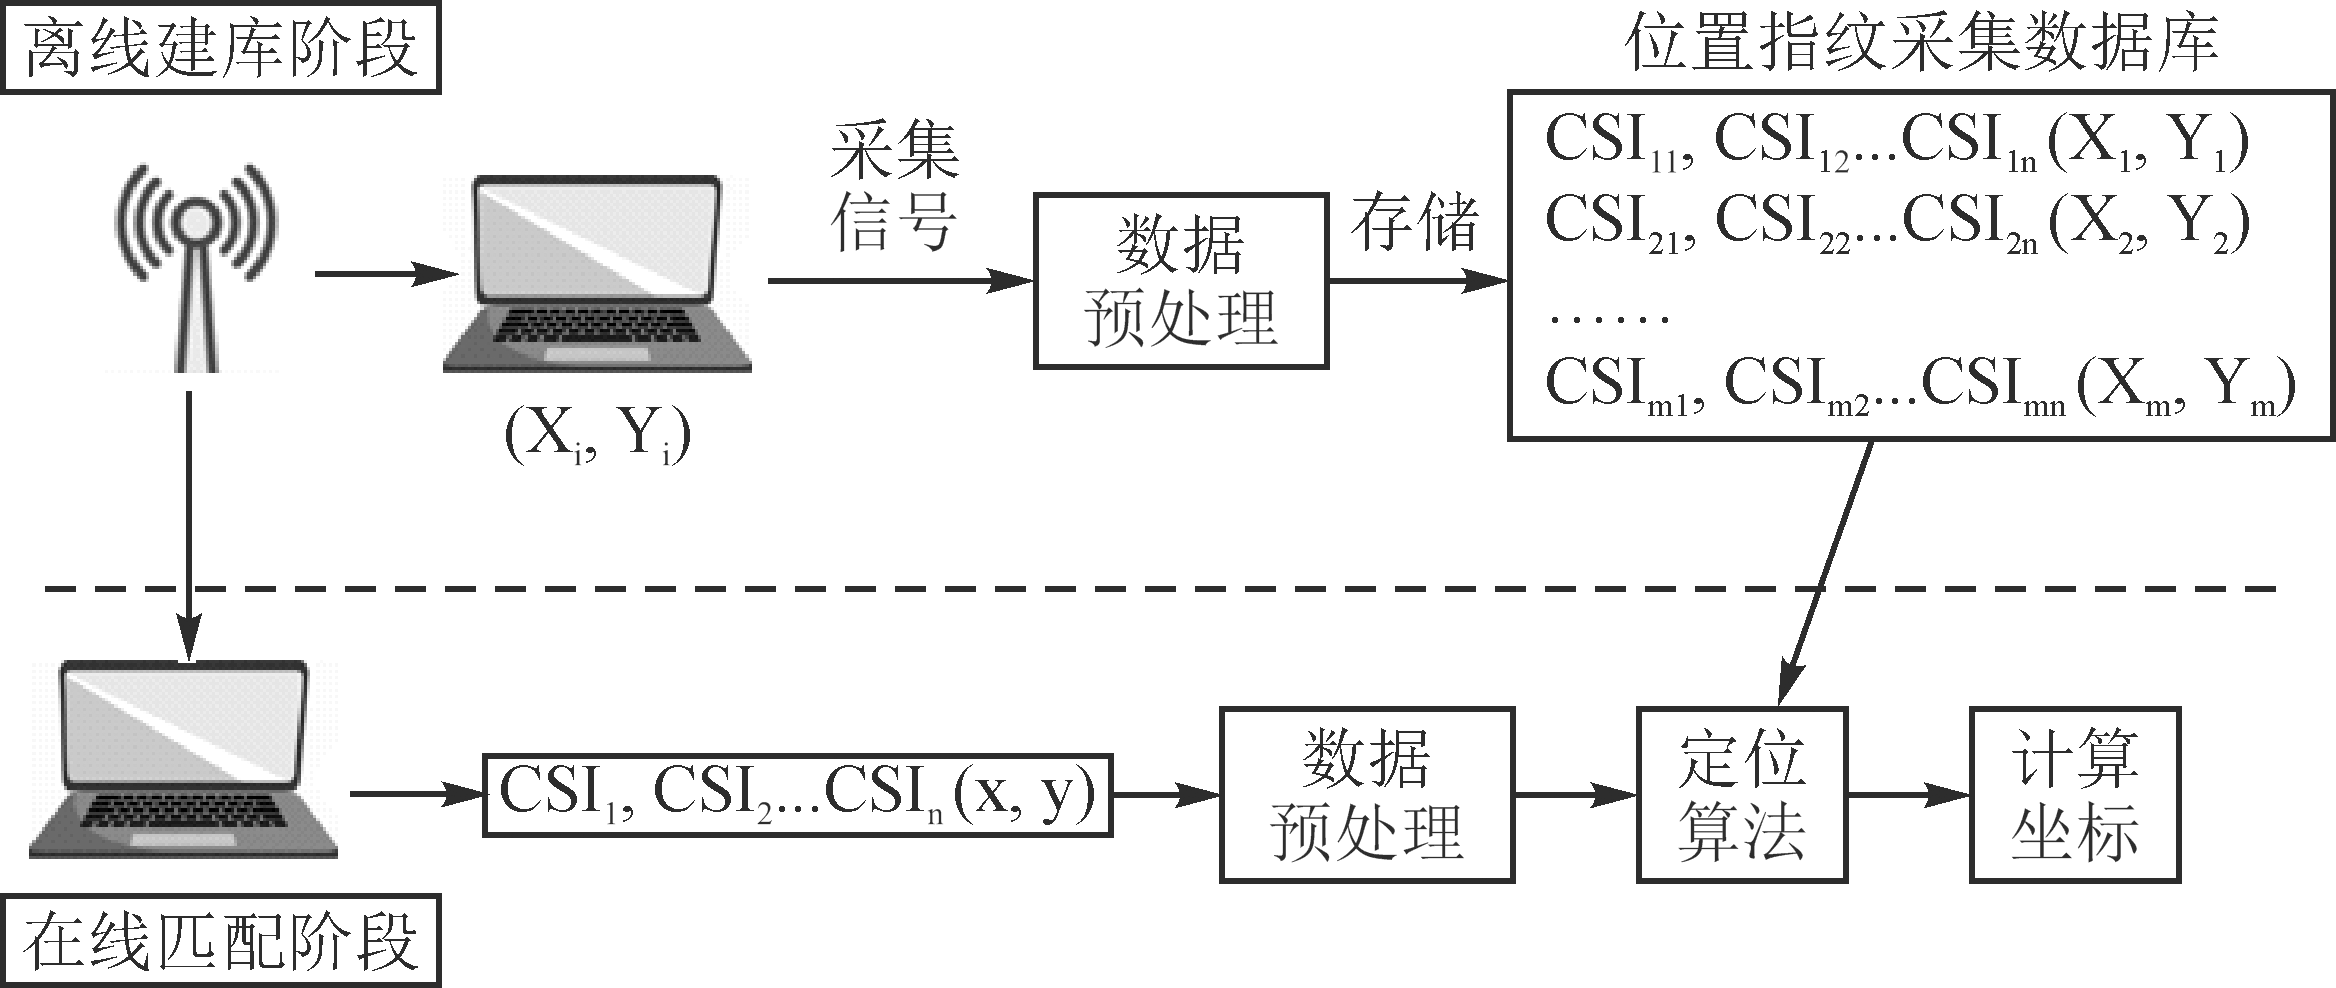
CSI fingerprint map localization algorithm
Fig. 5
CSI Fingerprint Data Sampling Point Map
Fig. 6
Comparison of positioning errors with different sampling intervals
Table 2
Experimental errors of three algorithms at a sampling interval of 0.3 m (Unit: m)
Table 3
Experimental errors of three algorithms at a sampling interval of 0.4 m (Unit: m)
Table 4
Experimental errors of three algorithms at a sampling interval of 0.5 m (Unit: m)
Fig. 7
Comparison of positioning errors among three algorithms at different intervals